
How to Recognize Exhaustion Tops & Capitulation Lows in NQ
Q: When trading NQ why does it seem to be easier to pick peaks rather than bottoms?
This is something a lot of futures traders notice, especially in fast instruments like the Nasdaq 100 (NQ). There are both psychological and structural reasons why peaks feel easier to spot than bottoms:
1. Market Microstructure of NQ
Tech-heavy & momentum-driven: The Nasdaq tends to overshoot on rallies and sell-offs because its components (AAPL, MSFT, NVDA, AMZN, etc.) are high-beta, momentum stocks. That creates sharp, emotional tops that are easier to recognize.
Order flow at highs vs. lows: Tops often form with exhaustion moves, blow-off candles, and aggressive selling stepping in (large wicks, volume spikes). Lows, on the other hand, are often grinding, V-shaped reversals without much warning.
“Catching a top is about spotting exhaustion; catching a bottom is about surviving fear. One rewards patience, the other punishes impatience.” — Futures Fred
2. Trader Psychology
Fear is sharper than greed: When price is stretched up, traders are on edge, looking for reversal confirmation. That makes “shorting peaks” feel natural. But at lows, catching a bottom feels like “standing in front of a train” — most traders hesitate.
Recency bias: Traders remember failed “bottom calls” more vividly because catching falling knives is punishing. This makes peaks feel cleaner in hindsight.
Confirmation bias: Tops are often confirmed by negative news or weak market breadth, while bottoms lack a clear external signal.
3. Technical Behavior
Resistance is often cleaner than support: Markets respect prior highs (especially overnight or intraday ranges). Support zones get “chopped” and tested multiple times, making them noisy.
Volatility skew: Nasdaq often sells off faster than it rallies. Peaks may line up with RSI/MACD divergences, VWAP extensions, or market profile “excess” areas — while bottoms are less technically orderly.
4. Algo/Market Maker Influence
Stop hunts at lows: Algorithms love to run stops below obvious lows, so the “real bottom” often comes after the level everyone is watching breaks. That makes bottom-fishing harder.
Liquidity pockets: Institutions offload size into strength (near peaks). By contrast, they accumulate quietly at lows, hiding their footprints. That accumulation doesn’t give traders a clean bottom signal.

✅ Takeaway for trading NQ:
Peaks are visible exhaustion events, easier to spot with volume + price action.
Bottoms are stealth accumulation zones, harder to identify until after the reversal.
That’s why many intraday traders on NQ prefer shorting into exhaustion spikes and waiting for confirmation before going long after a washout.
“In NQ, peaks shout their arrival with fireworks, but bottoms whisper. If you wait to hear the whisper, you’ll already be late.” — Futures Fred
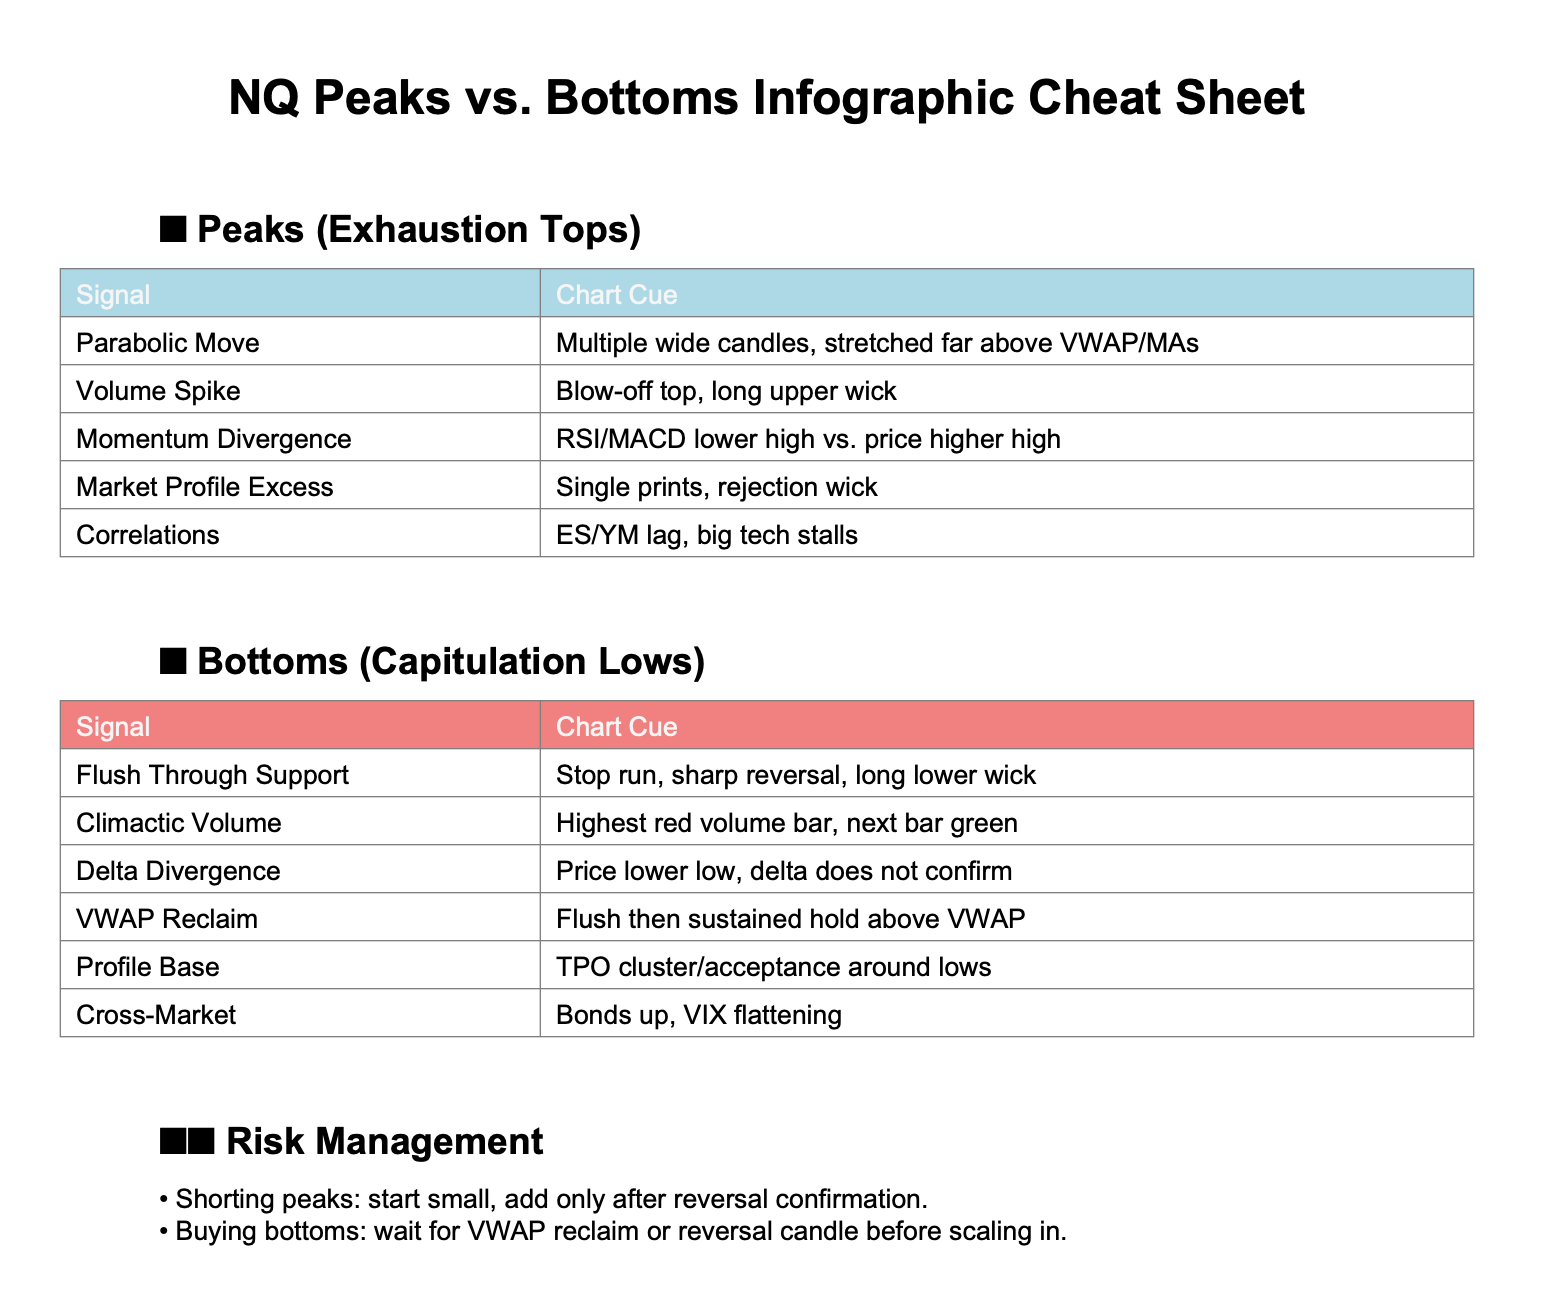
📈 Peaks (Exhaustion Tops)
These often come with fast, emotional spikes.
✅ Checklist
Parabolic move into resistance
– Multiple wide-range green candles stacking with little pullback.
– Price extended far above VWAP or moving averages.Volume spike / blow-off top
– Volume surges dramatically at the high.
– Candle leaves a long upper wick (failed breakout).Momentum divergence
– RSI or MACD makes a lower high while price makes a higher high.
– Tick index ($TICK) extreme readings (+1200 or higher).Market profile “excess”
– Single prints or thin volume nodes at the high.
– No sustained auction — just a rejection wick.Correlations
– ES or YM not confirming new highs while NQ stretches.
– Big tech leaders (AAPL, NVDA, MSFT) stall while index pushes.
📉 Bottoms (Capitulation Lows)
These are trickier because of stop hunts and fake-outs.
✅ Checklist
Flush through support
– Price breaks an obvious low, runs stops, then snaps back above.
– Large lower wick (rejection candle).Climactic selling volume
– Highest volume bar of the session on a red candle.
– Next bar closes green (buyers absorbing supply).Cumulative delta divergence
– Price makes a lower low, but delta (net aggressive selling) does not.
– Suggests passive buyers are stepping in.VWAP reclaim
– After a flush, price retakes VWAP and holds above.
– Often confirms that sellers are done.Market profile base
– Multiple TPOs building around a level (acceptance).
– Value area low (VAL) holding after a test.Cross-market confirmation
– Bonds rallying (risk-off stabilizing).
– VIX futures flattening or pulling back.
⚖️ Risk Management Rule of Thumb
Shorting peaks: Enter smaller on the first wick, add only if reversal confirms (lower high).
Buying bottoms: Wait for confirmation (VWAP reclaim, reversal candle). Scaling in too early is where most traders get cut up.